Visualising the results of complex security rules using oval-graph tool
Introduction
You scanned the computer with OpenSCAP and some rules in the security profile failed. Then you have a question: Why have the rules failed? The answer is simple. Take a look at the report and read what happened. But sometimes the report is not easy to read. Some rules are very complex and you can easily get lost in the information in the report.
See, for example, this screenshot of an openscap-generated HTML report showing results of a rule:
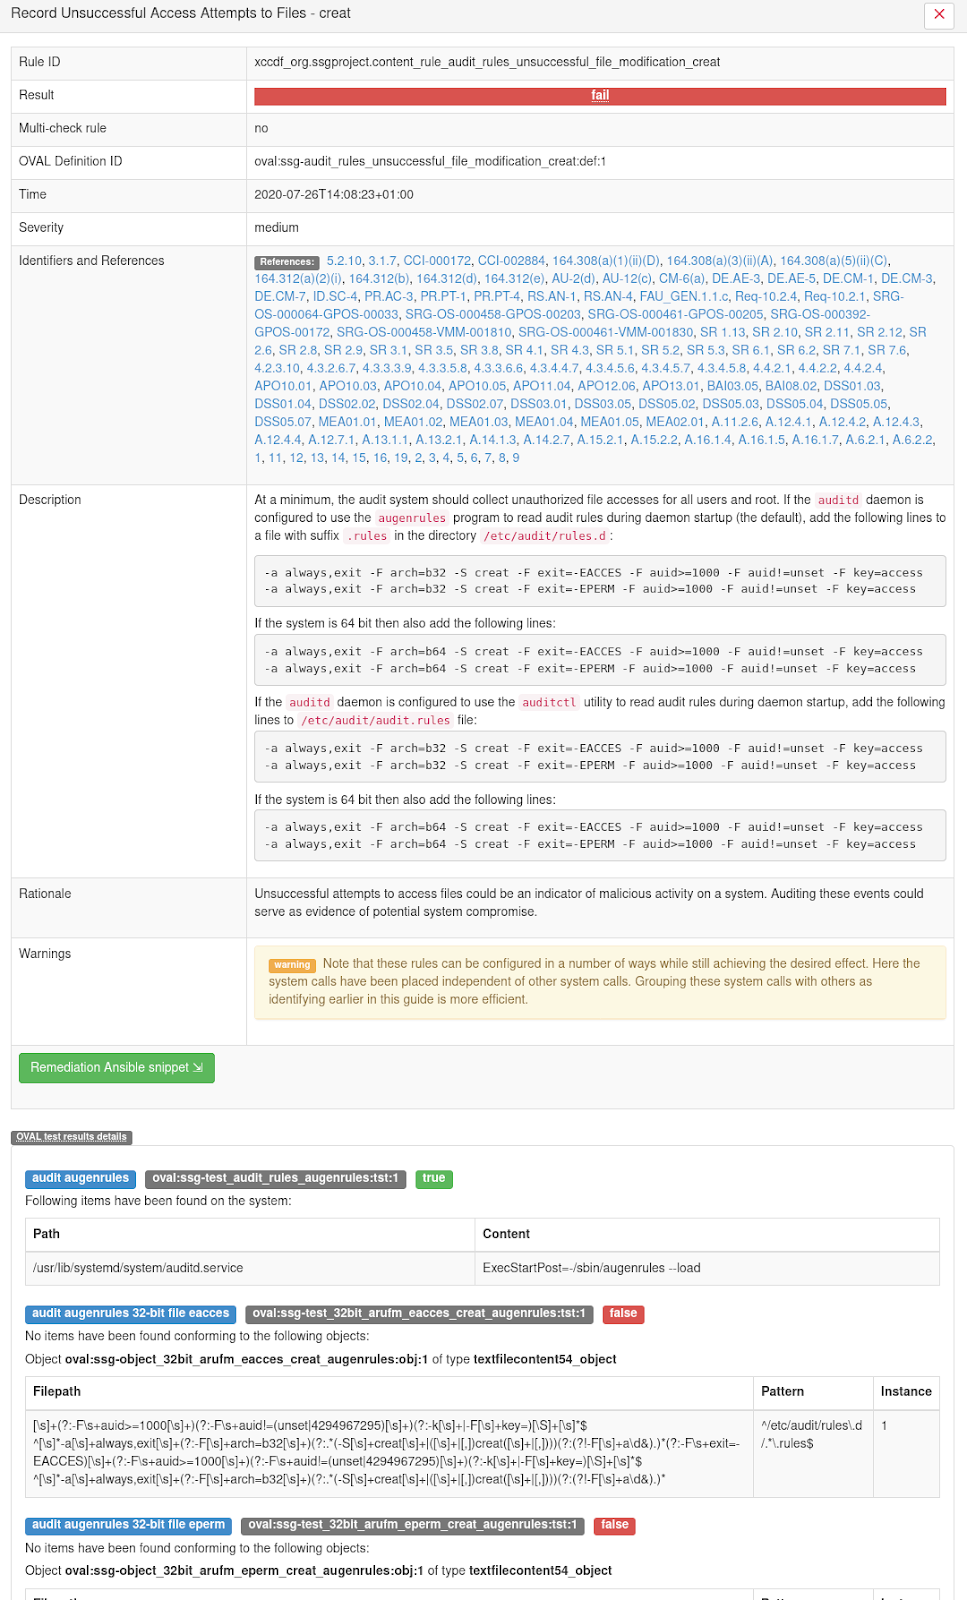
As you can see in the screenshot, HTML reports contain a lot of information, but when complex rules fail unexpectedly, it is hard to find out the real reason for the failure.
Problem: Best is not good enough
So far, a HTML report generated by openscap has been the best option for visualising OVAL results. But, it has some problems. Rules consist of OVAL tests that have a tree-like logical relationship. It is not necessarily a binary tree. Tests and criteria can be negated, which further increases the complexity. Unfortunately, the information about the relationship between the tests is missing in the HTML report. And this missing information about negation and relationship is essential for understanding what led to the result.
Let’s show the problem that can occur in the case of a complex rule. The picture shows the result of the rule´s details, where the results of individual OVAL tests are listed. The user would appreciate if the display of results also contained a logical connection between the individual tests.
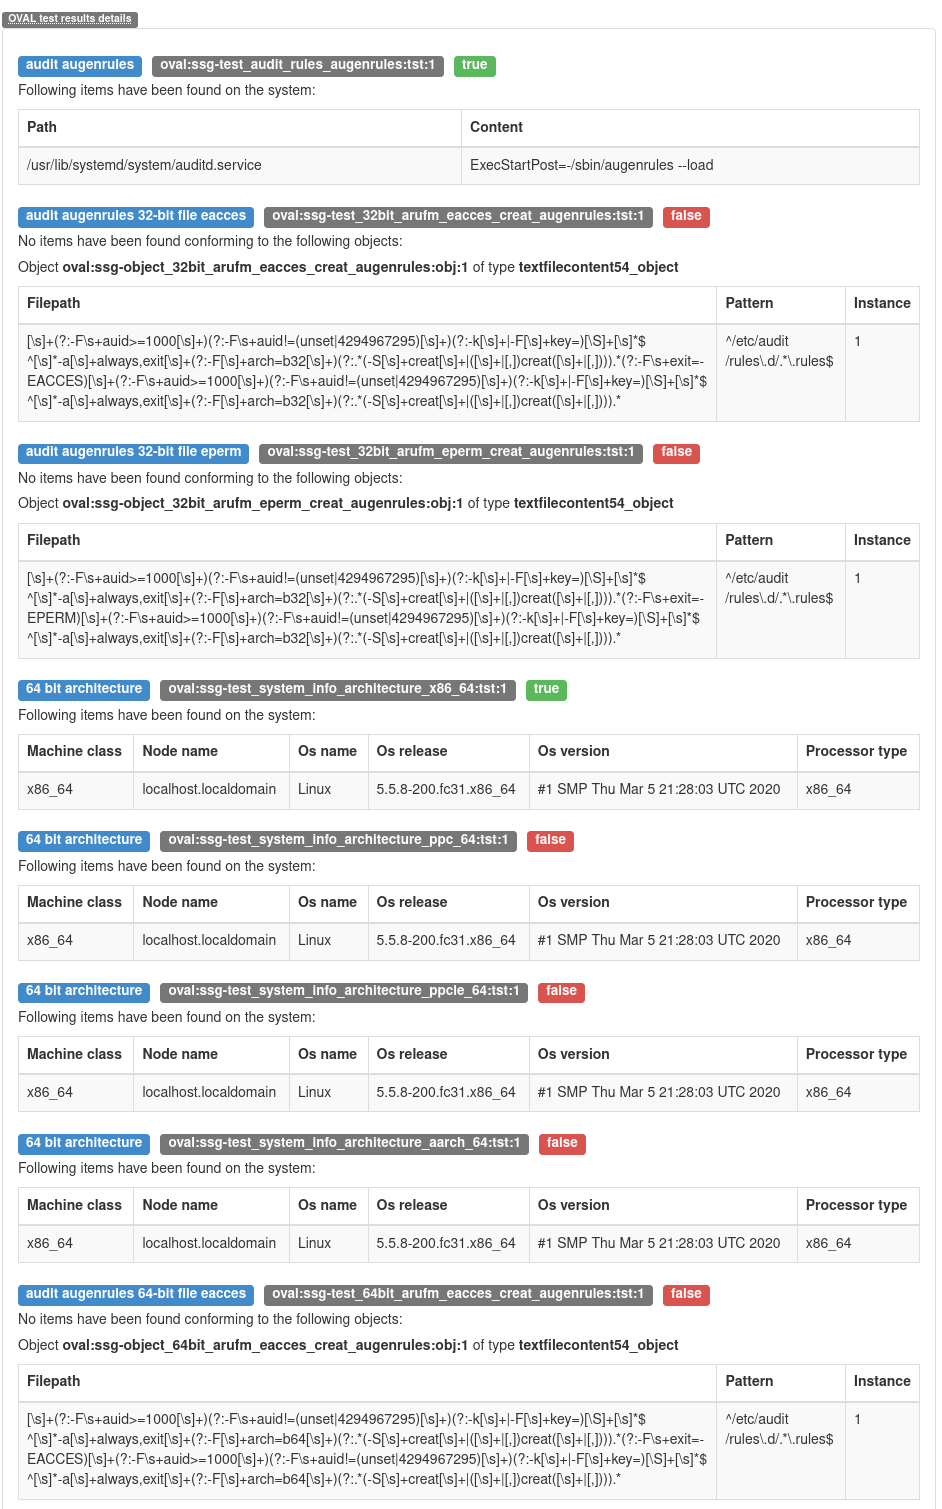
In this case, only information about individual tests are displayed. Take a look at the second test, which results in TRUE, and the other four tests below that TRUE test. These tests are linked by the OR operator, which is negated, and thus change the entire result of the rule. You can’t get this information from the HTML report. You can only get this information from another possible type of SCAP scanner report, so called ARF file, which is an XML file containing all the information about the performed scan.
Solution
This problem is solved by a tool called oval-graph. This tool is easy to install: It is available on PyPi or as a Fedora RPM. It is easy to use. This tool can display the complete result of the rule. In the form of a simple tree. That allows you to understand the complex rules in the blink of an eye. See, for example, the output of tool:
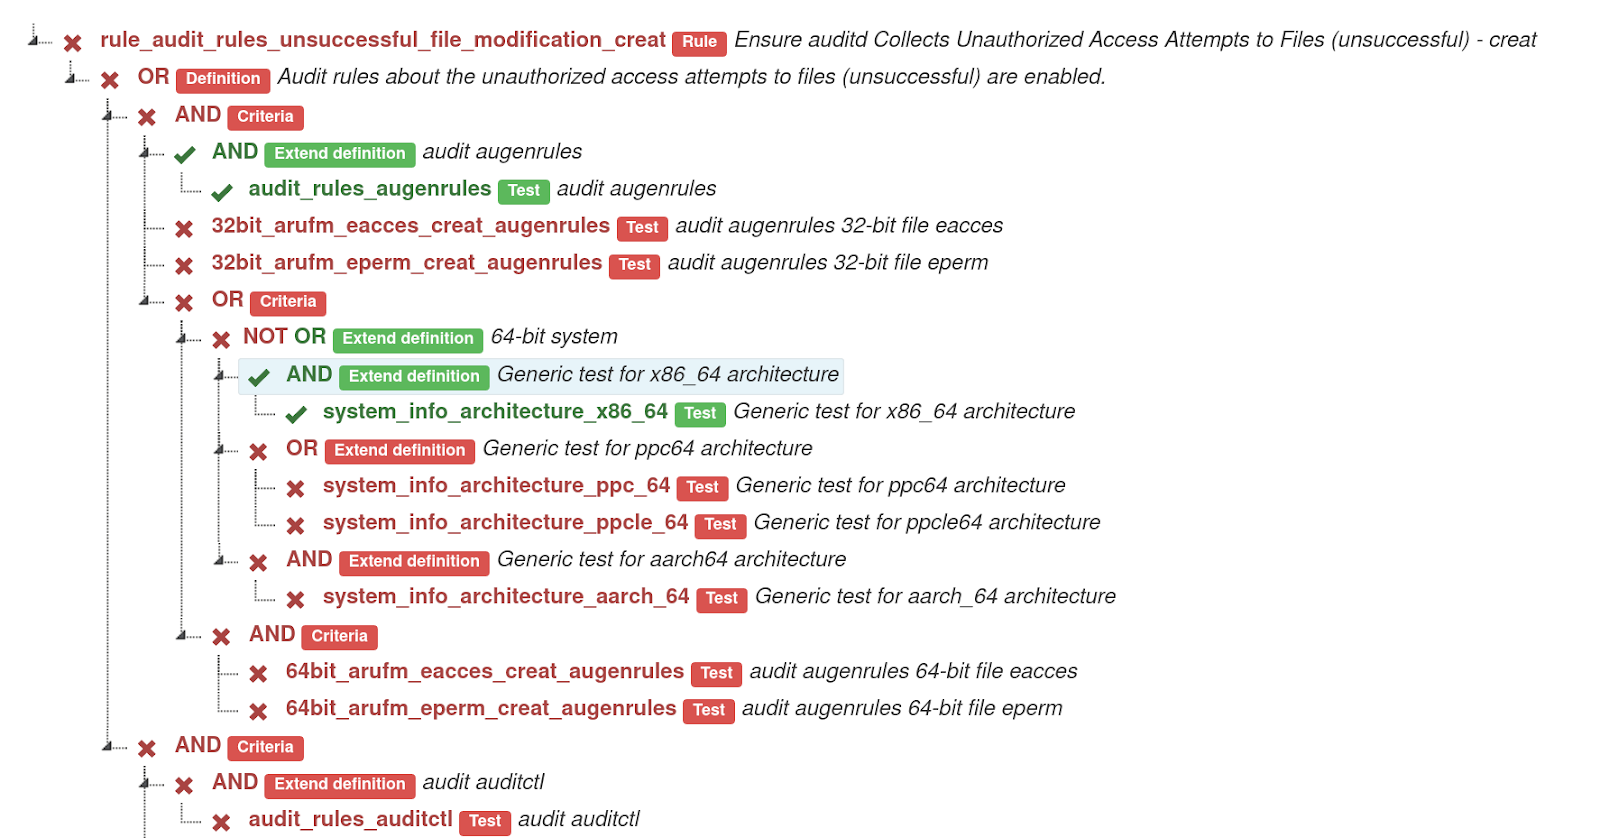
This tool shows the relation between tests, negation of operator and negation of test. See examples:
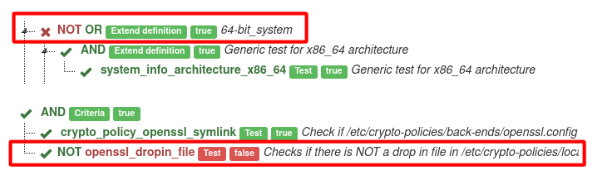
Generated graph is interactive. Click on test for details of test.
Also you can click on the operator and hide tests, definitions and criteria related to this operator.
Output of the tool can be an HTML with the visualization, or a JSON file, which contains only the scanning results that are relevant for the visualization. It is possible to generate HTML report from the JSON file, and it is also possible to edit the JSON in order to create what-if scenarios - you can easily change a selected test result, and then create a new recalculated graph from the modified JSON.
Installation
Fedora (EPEL)
dnf install oval-graph
Any OS - use PyPi
pip3 install oval-graph
Everyday usage
With command arf-to-graph you can easily transform ARF xml reports to nice graphs. This command consumes the rule name or regular expression of rule name and the ARF output, which is one of possible standardized formats for results of SCAP-compliant scanners.
For example: You use OpenSCAP to scan your system. The command below scans the computer with the Fedora operating system and uses the OSPP profile. This command generates HTML report (report.html) and XML report (arf.xml).
oscap xccdf eval \
 --profile ccdf_org.ssgproject.content_profile_ospp \
 --results-arf arf.xml \
 --report report.html \
 /usr/share/xml/scap/ssg/content/ssg-fedora-ds.xml
The output of oscap command looks like this:
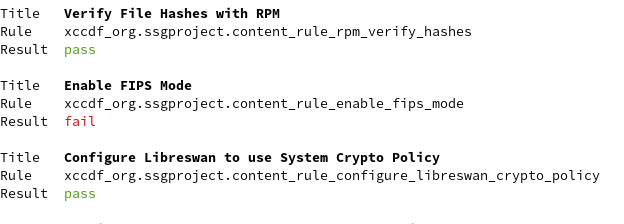
In the output of the command we can see a failed rule named “Enable FIPS Mode” (xccdf_org.ssgproject.content_rule_enable_fips_mode). We can read some information about this rule in the HTML report.
See information in HTML:
This rule looks like one of complex rules. There are many tests and we can’t see any relation between tests. Fortunately, this relation can be displayed with command arf-to-graph.
Here is the command. First parameter is the arf file and second is part of the rule name.
arf-to-graph arf.xml enable_fips_mode
This command generates a graph and saves a file named graph-of-<rule_id>-<date>.html (the date the graph was created) in the working directory. Then, it opens the generated file in your web browser. Learn more information about usage in the user Guide.
You can read more about generating ARF report files using OpenSCAP in the OpenSCAP User Manual. Or you can use test arf files from repository /tests/test_data.
Here is a live demo of the generated file. This graph is interactive. You can
- hide part of the rule criteria tree
- display any information about the test in the rule
Thanks to the graph we can see in the blink of an eye where the problem is.
DEMO graph of “Enable FIPS Mode” (xccdf_org.ssgproject.content_rule_enable_fips_mode)
Conclusion
The oval-graph tool helps users solve the complex rule conditions that are contained in SCAP security profiles. This tool contains commands which users can use to solve their problems. In the future, we plan to put the generated graphs to the HTML report to make the ultimate report which users appreciate. I believe it will be possible to implement this feature directly in the OpenSCAP scanner.